
If It Can’t Be Measured, It Doesn’t Exist
Speed is your #1 measure of performance, slow is the new down.

Your new digital platform just went live, that was a big job but now what? How do you know what’s working and what’s not? Where are your users coming from and what are they doing? Getting your platform up and running is exciting, but it’s just the beginning. Monitoring your platform and improving what resonates with your users makes it great.
Speed is your #1 measure of performance, slow is the new down.
“Slow is the new down.”
Real-world scenario: you’re in a cab searching Yelp or Foursquare for a place to eat. You find one that sounds awesome and is well-reviewed. You tap the URL to load the homepage. The platform isn’t optimized for mobile and takes a long time to load. Your meter is ticking and when the site loads, its formatting ruins all credibility. What would you do? I’d tap back to Yelp and choose another restaurant. If you owned that first restaurant, you just lost a customer — bummer, but we can fix that.
“On average 53% of users abandon their attempt if a site takes longer than 3 seconds to load.”
We use Google Page Speed to get a report of key performance indicators (KPIs if you like acronyms). This data provides insight into the current state of a platform and what we can do to improve it. For example, we could see Gastown’s previous site was performing poorly, specifically because images weren’t optimized for mobile. Gastown’s previous site’s rating was 42 for mobile and 56 for desktop. Dismal but standard when we partner with organizations to improve their digital presence. The new platform now ranks 90 on mobile and 86 on desktop — huge improvement in performance!
Go ahead, run a quick test to see how your platform stacks up here.

Observing user behavior with Google Analytics is a powerful way to find out where users are spending their time on your platform. Remember the user journeys we mentioned in our UX post? Analytics allow us to see if the assumptions about your user’s path through the platform are correct. If not, it’s time to investigate the things that might be getting in their way and focus on optimizing the pages that are most popular.
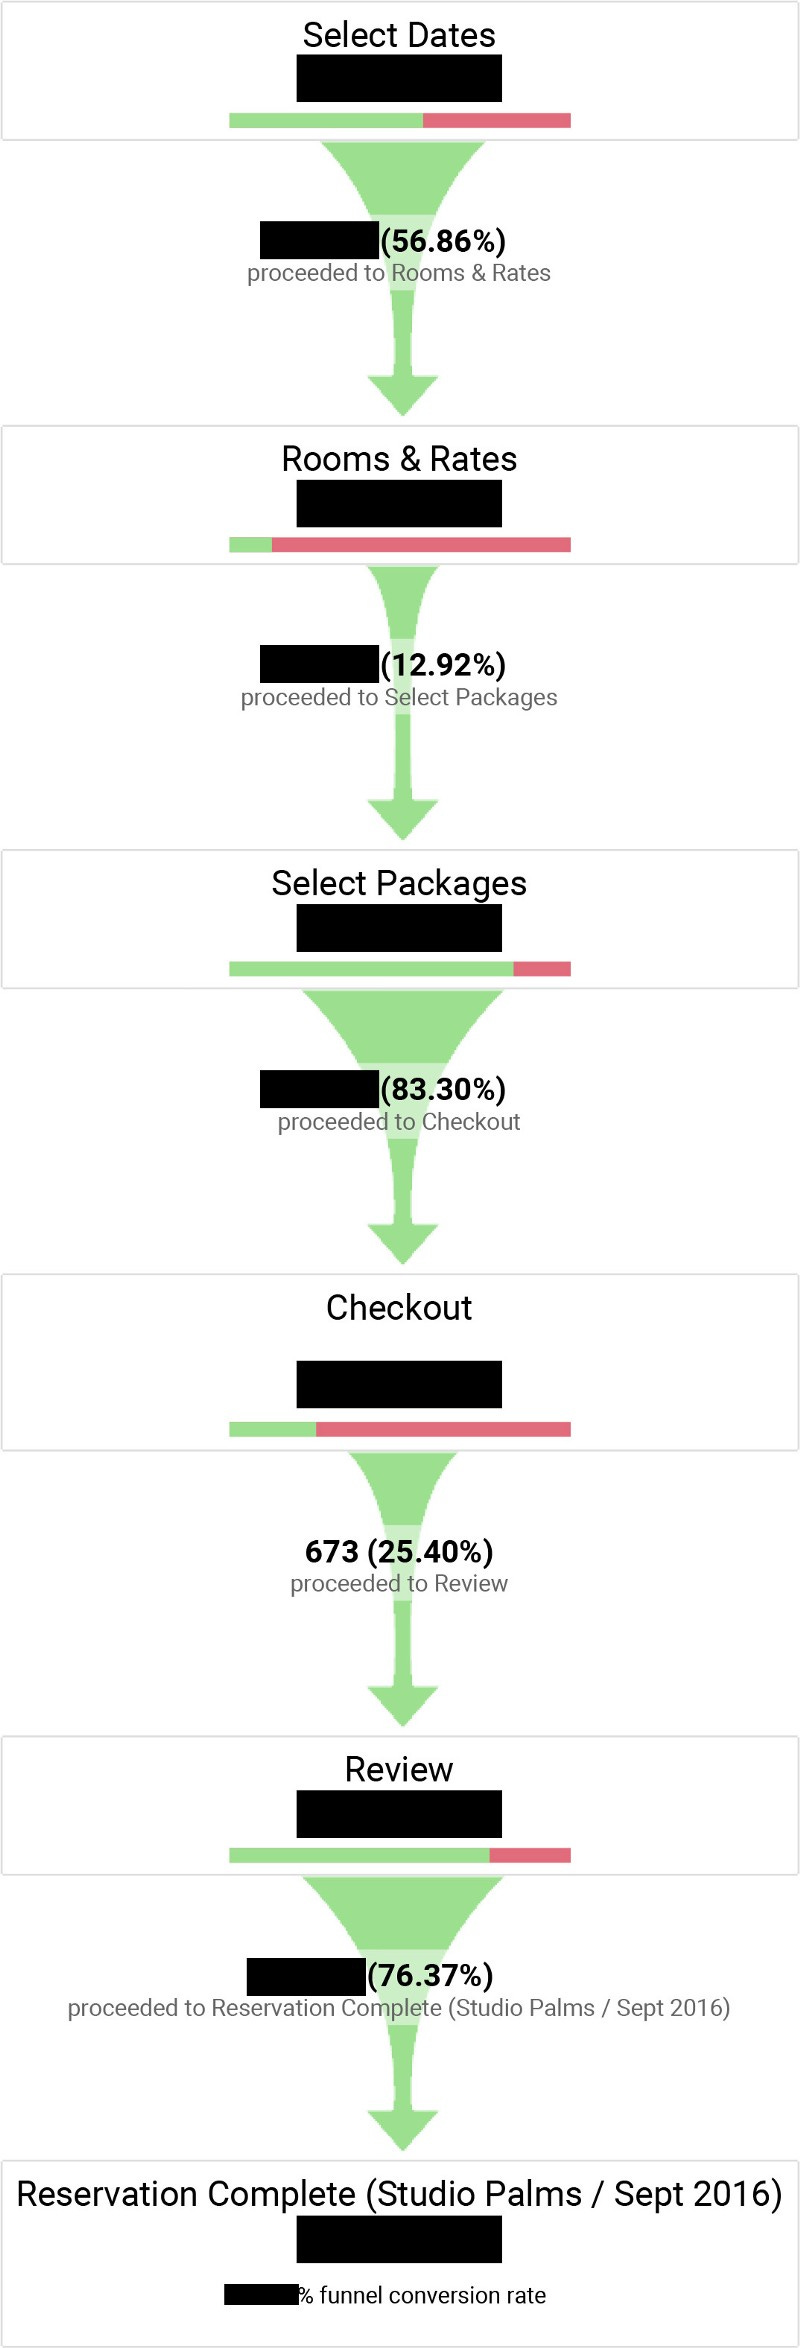
The example below is for the true data lovers. Using Google Analytics we can assess success and drop-off rates for things we want users to do. Using this info we can optimize screens and track how our changes affect conversion rates.
Google Analytics also helps us track the way users get to your platform. This provides valuable intel that can help guide your communication efforts. For example, we learned that the majority of referrals to Capture Photography Festival were coming from Facebook. This makes sense because Facebook allows links to be posted in comments. Without data, one might assume that for a visual-first organization like Capture, Instagram would be their greatest source of traffic. You can’t argue with the numbers, now Capture can confidently focus their efforts on the appropriate channels.

We’re huge data geeks. It’s the only way we can validate the work we do — a gut feeling doesn’t cut it when we’re trying to build valuable business tools. So if you haven’t already, we highly recommend setting up Google Analytics and for bonus points Google Search Console. These services provide an awesome starting point. It takes time to collect data so get started on the road to making meaningful changes.
In our final post about ways to enhance your digital presence, we’ll tie it all together by exploring web-based tools that can have a major impact. Any other data fans out there? Hit us up and we can get into it.
What We Talk About When We Talk About Business Tools

Our first post in this series: highlighted the potential of your digital platform to function as a business tool. But what does that really mean? Google and Facebook have taught us that an online experience should do something for us, and do it quickly — we’re all so busy and important. Web-based tools can accomplish this while providing lasting value to…