Strategic Composition for Digital Teams: An Economic Approach
The Economics of Agile Team Structure
Building digital products that people love is hard. Humans are emotional and irrational which makes us hard to design for. Equally challenging is determining the ideal team composition across various disciplines to create a high-performing team. This post seeks to demonstrate that smaller agile sprint teams, when analyzed through the lens of marginal costs and productivity, have the potential to outperform larger teams, regardless of whether they operate under agile or waterfall methodologies. Our analysis will be exclusive to agile teams.
Key factors of agile product teams and waterfall development teams are:
Agile processes emphasize the importance of effective informal communication among developers, and of iterative improvement of implementations driven by use-case scenarios, and they champion small cohesive development teams over large structured units. (Estler et al., 2013)
Waterfall methodology, also known as the linear sequential lifecycle model, is defined by its linear, structured approach to project management. It is made up of a series of steps that are completed in sequential order within the software development life cycle. (Kavlakoglu, 2020)
A digital product team includes roles such as a Product Manager, Product Designers, Software Engineers, and an Engineering Manager, with possible support from Data Analysts or UX Researchers. A Product Manager is explicitly responsible for ensuring value and viability; the Product Designer is responsible for ensuring usability; and the Engineering Manager is responsible for ensuring feasibility. (Cagan, 2019) My experience suggests that using Frontend Engineers as a benchmark for team composition ratios yields the highest quality, efficiency, and speed of delivery.
The "Typical Work Multiplier," presented in Table 1, represents the standard workload for each discipline to achieve success. When scaled against the Frontend Engineer's multiplier, it helps determine optimal team ratios. Table 1 also lists example annual salaries (in USD, representative, not actual) for each role, constituting the fixed costs in our analysis.
Table 1
Digital Product Team Composition
The workflow through the digital product team, as outlined above, is depicted in Figure 1.
Figure 1
Flow of work from start to finish on a digital product team
Roles that enhance the efficiency of subsequent positions act as force multipliers. For example, Product Managers boost team effectiveness by defining business goals and metrics. UX Researchers and Data Analysts provide essential data for decision-making to Product Designers and Management. Product Designers convert these insights into functional prototypes and final designs. In the transition from prototype to finished product, the Engineering team works in tandem with Product Designers to develop the work into a complete digital product, with Engineering Managers ensuring process quality and efficiency.
Utilizing two years of data from GitLab’s Digital Experience team, which has a biweekly sprint delivery rate of 20 points per sprint (1pt = 0.5 day) (Preuss, 2020), we identify the ideal digital product team composition.
Table 2
Sprint points per person over time
We model the diminishing returns associated with increased team size using the rates in Table 3. This concept has also been referred to as Brooks’ Law:
Software projects are complex engineering endeavors, and new workers on the project must first become educated about the work that has preceded them.
Communication overhead increases as the number of people increases. (Wikipedia, 2022)
Table 3
Rate of diminishing return
Our analysis, beginning with Frontend Engineers as the "work ratio" basis from Table 1, shows in Table 4 that expanding the team from five to six Frontend Engineers leads to decreased marginal productivity. In essence, the addition of the sixth Frontend Engineer reduces, rather than increases, sprint point output. This is mirrored in the cost analysis, where average total and fixed costs also rise when transitioning from five to six Frontend Engineers. The interaction between marginal productivity and marginal cost suggests that the team's efficiency improves when increasing from two to three Frontend Engineers but decreases when adding a fourth. Thus, multiplying average marginal productivity by average marginal cost indicates the highest return on productivity occurs with three Frontend Engineers.
Table 4
Frontend Engineers
In Figure 2, isolating economic indicators like sprint points, average marginal productivity, average marginal costs, and average variable costs (Frontend Engineer salaries) highlights inefficiencies. With six Frontend Engineers, average variable costs surpass the sprint points delivered, and average marginal productivity becomes negative. An economist would deduce that five Frontend Engineers maximize a digital product team's output, and any number beyond that is inefficient.
Figure 2
Frontend Engineers with Average Total Cost
Figure 3
Frontend Engineers without Average Total Cost
Figure 3 provides an alternative view, showing that with three Frontend Engineers, average marginal costs are lower than the sprint points delivered. Figure 4 further illustrates that return on productivity peaks with three Frontend Engineers.
Figure 4
Frontend Engineers Return on Productivity
Brooks’ Law is evidenced by the cost savings when scaling from one to two Frontend Engineers. As shown in Figure 3, the average marginal cost is lower than the sprint points delivered, and Figure 4 shows that productivity return is maximized at three Frontend Engineers, indicating the optimal team number.
Using the optimal ratio of three Frontend Engineers, we can calculate the sprint points needed for maximum efficiency, as seen in Table 5. For instance, if Frontend Engineers require 80% of a Fullstack Engineer's output, which translates to 140 sprint points per quarter, we can align the number of Fullstack Engineers needed, as demonstrated in Table 6. These calculations take into account the efficiency of subsequent roles.
Table 5
Frontend Engineer Sprint Points Needed From Fullstack Engineer
Table 6
Fullstack Engineer
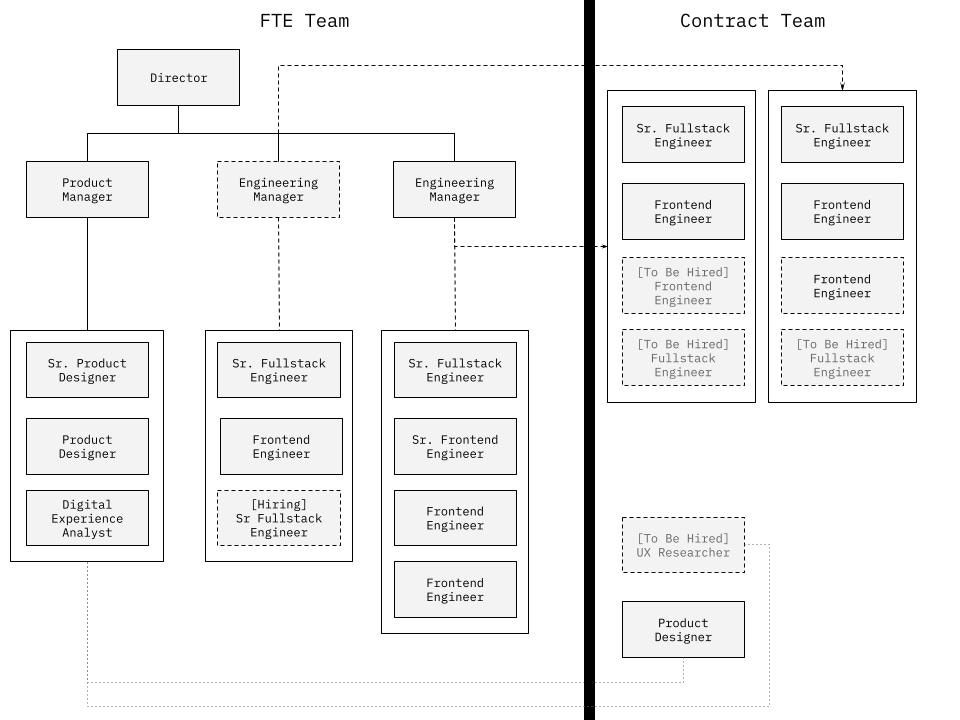
As mentioned earlier, constructing high-performing digital product teams is often counterintuitive. This economic analysis of average marginal productivity and cost has revealed inefficiencies in my initial approach to team organization. Previously, I matched the number of Engineering Managers to engineering teams needed, as Figure 5 shows.
Figure 5
Original Team Composition Plan
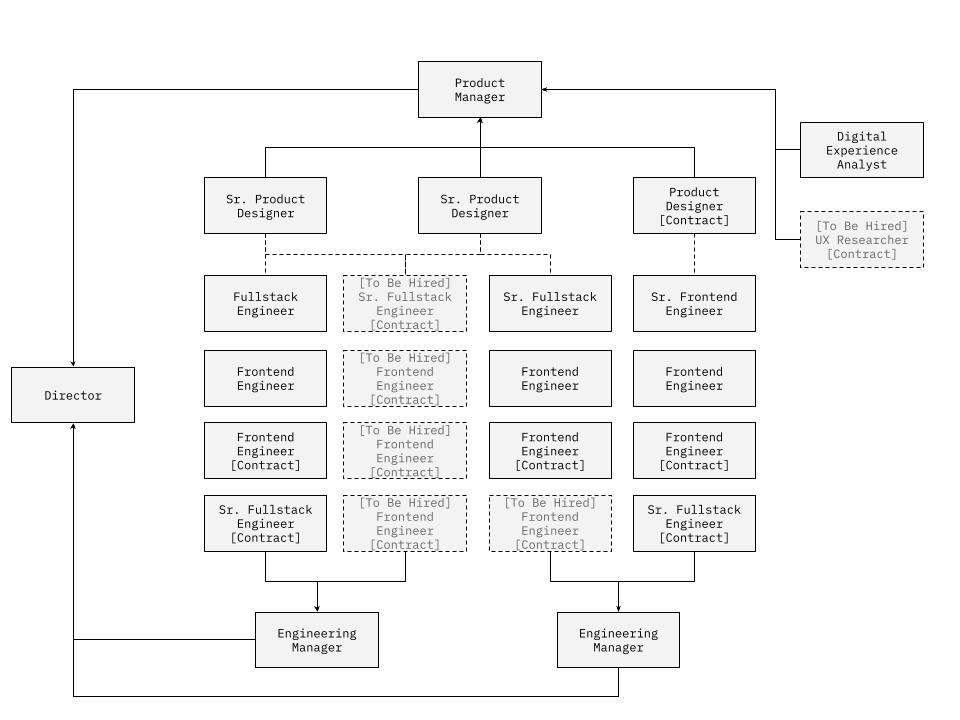
However, recognizing that three Frontend Engineers per digital product team is optimal, I've revised the team composition into four smaller, more efficient teams, detailed in Table 7 and depicted in Figure 6. This reorganization not only improves efficiency but also allows us to more accurately predict quarterly sprint point delivery.
Table 7
Optimal Team Composition
Figure 6
Optimal Team Plan
Understanding the principles of marginal cost, average costs, marginal revenue, marginal output, fixed costs, and variable costs has fundamentally shifted my approach to team composition and resource allocation. This knowledge has made me a more effective, strategic leader.
REFERENCES
Estler, H.-C., Nordio, M., Furia, C. A., Meyer, B., & Schneider, J. (2013). Agile vs. Structured Distributed Software Development: A case study. Empirical Software Engineering, 19(5), 1197–1224.
Kavlakoglu, E. (2020, November 4). Agile vs. Waterfall. IBM. Retrieved March 23, 2022, from https://www.ibm.com/cloud/blog/agile-vs-waterfall
Cagan, M. (2019, September 18). Product vs. Feature Teams. Silicon Valley Product Group. Retrieved March 23, 2022, from https://svpg.com/product-vs-feature-teams/
Preuss, M. (2020). Digital Experience Handbook. GitLab. Retrieved March 23, 2022, from https://about.gitlab.com/handbook/marketing/inbound-marketing/digital-experience/#sprint-planning
Pierreten. (2020, June 20). How do you create a formula that has diminishing returns? Stack Overflow. Retrieved March 23, 2022, from https://stackoverflow.com/a/2813655
Wikimedia Foundation. (2022, March 21). Brooks's Law. Wikipedia. Retrieved March 23, 2022, from https://en.wikipedia.org/wiki/Brooks%27s_law


