
Unified GTM & Business Metrics
From proof to profit: one GTM scoreboard
Timeframe
Aug 2024 to Sept 2025
Company
VRIFY
Role
VP Marketing
Read time
2 min
Read with...
- 01One GTM scorecard with shared definitions, owners, and cadence
- 02To / Through / In model tied to pipeline and efficiency
- 03Weekly business review focused on the current constraint
This is a deep dive in the VRIFY case study.
As VP Marketing, I helped design the GTM scorecard and weekly business review so the whole org could see the constraint and act fast.
A category and a motion are only as strong as the scoreboard that guides them. We moved the org to a single, shared scorecard that connects To → Through → In (Demand → Content/Digital Experience/Lifecycle → Sales/Proof) and ties every program to efficiency (payback, GSE).
The loop: proof → demo → win.
This page explains the operating logic, the metrics that matter, and how we decide what to start, stop, or scale.
What changed: We stopped reporting channel metrics in isolation and ran one GTM scorecard with shared definitions, owners, and a weekly cadence.
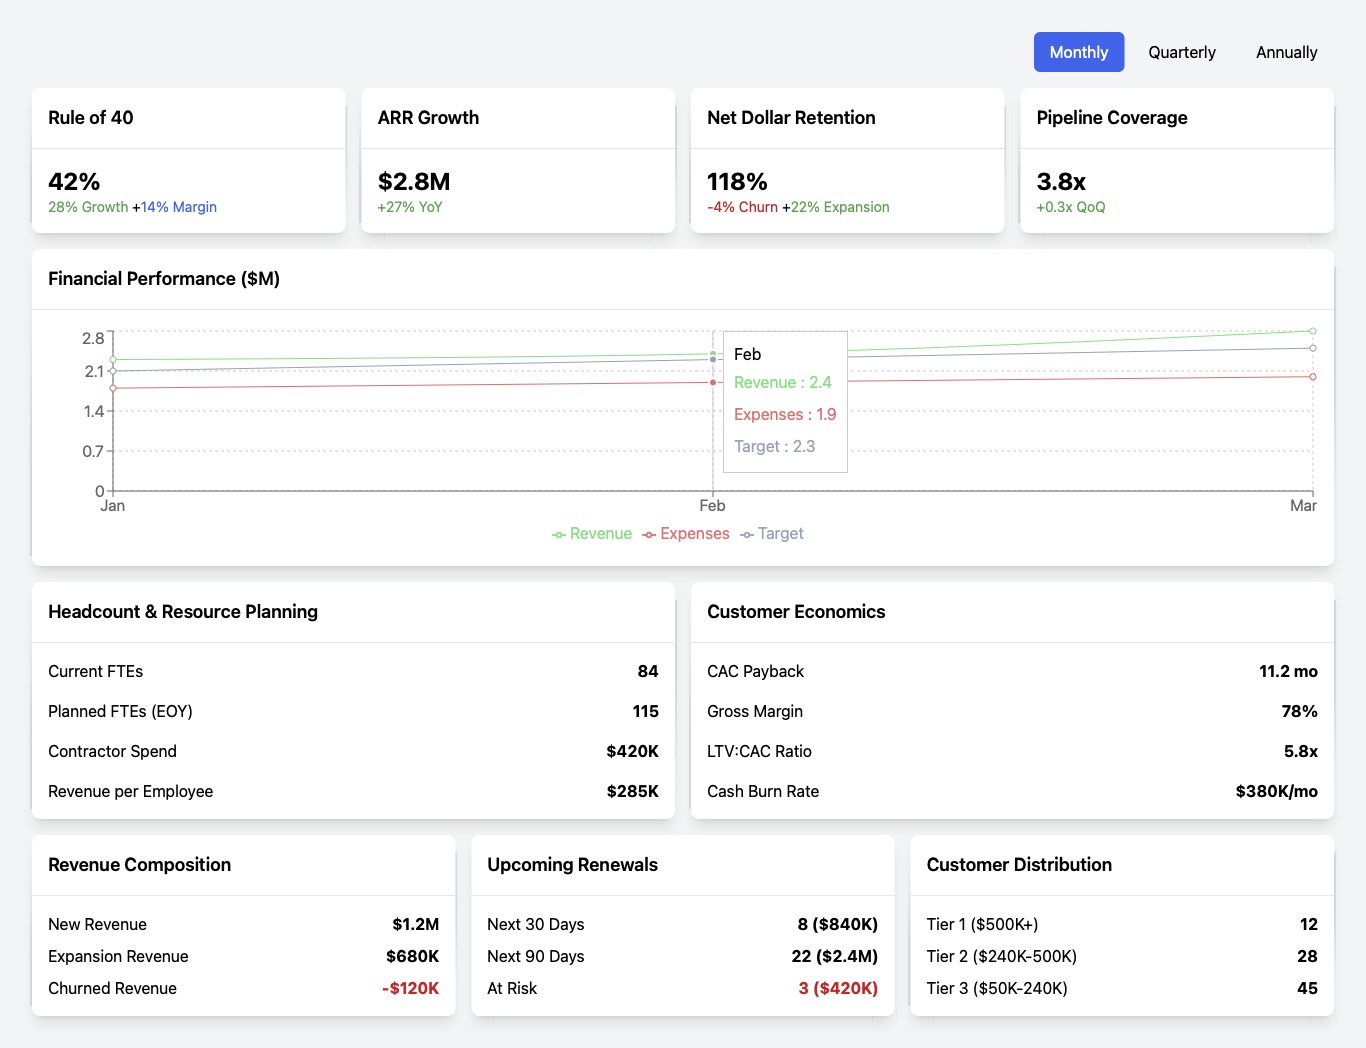
Why one scorecard
- End debate on definitions, align Marketing, Sales, CS, Product on the same truth.
- Make trade‑offs obvious (focus on the constraint in the system).
- Tie program outcomes to pipeline, revenue, and efficiency, not vanity metrics.
The model (To, Through, In to efficiency)
- To (Demand): sessions, qualified demo requests, meetings, cost/meeting.
- Through (Content, DX & Lifecycle): content‑assisted meetings, site CTR, demo rate (meeting→demo), demo quality, nurture influence.
- In (Sales & Proof): meeting→SQL, proof → demo conversion (macro), demo→pilot/proof (in‑cycle), win rate, cycle days, forecast accuracy.
- Efficiency: CAC payback (months), GSE (Core/Lagged/Magic), ACV mix, NRR/GRR.
Cadence and decision rights
- Weekly Business Review: scorecard review. Pick the single bottleneck currently limiting ARR (coverage, demo path, proof capacity, stage hygiene, or paper process). Commit a 1-2 week fix with an owner and metric.
- Monthly: experiment read‑outs, budget reallocation, re‑tier ABM lists, stage hygiene audit.
- Quarterly: OKR close & commit, pricing/offer updates, resourcing shifts.
- DRIs: named per metric (owner, source, refresh day, acceptance criteria).
Metric dictionary (owners)
Demand: Content / DX / ABM / SDR
Through: Content / DX / Lifecycle / AE
In: Sales Mgr / AE / CSM / RevOps
Efficiency: Finance / RevOps
Outcomes
Results
- Coverage: 3-4× pipeline coverage, Tier‑1 coverage 80%.
- Conversion: meeting→SQL 65%, proof→demo 60%, opp→win 80% (+30 pp).
- Velocity: cycle days ↓ 25 days, time‑to‑first‑meeting 30 days.
- Efficiency (mirrored): CAC payback ~2.5 months, GSE ~1.9×.
- Events ROI: USD 12M net-new ARR in 120 days post‑PDAC. Largest first‑month sales increase in company history (July, Q3 M1).
Decision support
FAQ: Fast answers, no filler
The objective, outcomes, and next best path in under a minute.
01What is VRIFY Unified GTM & Business Metrics?
A deep dive on the single GTM scorecard, shared definitions, and weekly business review that made constraints visible and decisions faster.
02What problem did the scorecard solve?
Teams reported channel metrics in isolation. The scorecard unified pipeline coverage, conversion, velocity, and efficiency under one weekly operating cadence.
03What was built in the GTM scoreboard?
A single scoreboard with shared definitions, clear owners, and a weekly business review focused on the current constraint.
04What results are documented?
Pipeline coverage reached 3 to 4× with Tier-1 coverage at 80%. Cycle days decreased by 25 days, CAC payback was ~2.5 months, and PDAC delivered $12M net-new ARR in 120 days.
05Who is this approach for?
Best for cross-functional GTM teams that need one source of truth and weekly constraint management. Less useful for single-team motions with minimal handoffs.