Introduction of X Led Growth
Unified To/Through/In motion, DRIs, and shared metrics
Timeframe
Jun 2020 to Aug 2024
Company
GitLab
Role
Director, Integrated Growth and Inbound Marketing
Read time
10 min
Read with...
- 01Simplified segmentation to Commercial vs Enterprise
- 02Proposed To/Through/In team structure with explicit DRIs
- 03Codified shared metrics (traffic, trial conversion, ARR contribution)
This is a memo I wrote at GitLab as Director of Integrated Growth and Inbound Marketing, to align Digital Strategy, Digital Experience, and Growth on a single operating loop for Commercial PLG and Enterprise sales-assisted growth.
With two peer leaders, we simplified our segmentation to two groups (Commercial and Enterprise), then used this business case to secure exec sponsorship and define DRIs, shared metrics, and cross-team handoffs.
Results: operating clarity and focus
- Created a shared operating model across three teams (To, Through, In), with explicit DRIs and shared metrics.
- Simplified segmentation to Commercial vs Enterprise to increase focus and iteration speed.
- This became the operating backbone for the inbound traffic recovery plan and unified funnel work.
- Downstream, we lifted trial conversion by 40% and account sign-ups by 22%. See Unified Funnel Conversion Lift
In my experience, a common challenge for B2B SaaS products is using digital channels to market and sell to different customer groups. The common groups are small/medium businesses (SMB), mid-market businesses (MM), and enterprises (ENT). Buyers amongst these groups have similarities and differences, and the differences make it hard to market and sell to each group effectively.
By constantly iterating, testing, and doing customer research, we recognized that with our buyers, we could simplify and divide into two groups: Commercial (SMBs and smaller MMs) and Enterprise (larger MMs and ENT).
With this insight, in collaboration with two key peers, we decided our best strategy was to focus on the Commercial segment first. Even though the deal size and contribution to the business were smaller, we had significantly more prospects and deals to iterate faster. Below are two memos that summarize the learnings and plan as we made progress toward defining, operationalizing, and monitoring our self-serve Commercial product-led growth efforts.
The model: To, Through, In
Traffic was down and conversion was down. The bigger problem was operational: Digital Strategy, Digital Experience, and Growth were each optimising locally without a shared funnel definition, shared DRIs, or shared metrics.
This memo proposes a simple operating model called To, Through, In:
- To owns qualified traffic into the funnel
- Through owns the marketing site journey to a clear action
- In owns activation and conversion inside the product
The ask was exec sponsorship, clear decision rights, and a cadence that forced tradeoffs using one scoreboard.

Proposed Team Structure And Roles
-
To: Digital Strategy Team
-
Responsible for driving inbound marketing tactics to generate traffic to the Marketing site.
-
Key responsibilities include SEO, paid advertising, email marketing, social media marketing, and content marketing strategy.
-
Collaborate closely with the Digital Experience and Growth teams to ensure alignment on the target audience, messaging, and campaign goals.
-
-
Through: Digital Experience Team
-
Responsible for creating and optimizing customer-centric, product-led growth experiences on the Marketing site.
-
Key responsibilities include user experience, user journey optimization, and engineering.
-
Collaborate closely with the Digital Strategy and Growth teams to ensure a seamless transition from traffic generation to a free trial, account sign-up, or license purchase.
-
-
In: Growth Team
-
Responsible for conversion-focused design and product-led growth initiatives to turn prospects into customers and engage users within GitLab’s product.
-
Key responsibilities include conversion rate optimization, user onboarding, product usage analysis, and A/B testing.
-
Collaborate closely with the Digital Strategy and Digital Experience teams to ensure alignment on user journeys and conversion goals.
-
Pain points: fragmented ownership and incentives
-
Declining Traffic: The current YoY decline in traffic indicates that the existing approach to driving website visitors should be more effective. This decline has the potential to impact the overall pipeline and ARR negatively.
-
Inefficient Coordination: A lack of alignment and coordination among the Digital Strategy, Digital Experience, and Growth teams can lead to redundancies and inefficiencies in marketing efforts, resulting in wasted resources and missed opportunities.
-
Suboptimal Conversion Rates: Current conversion rates from the Free Trial Signup page are lower than desired, highlighting an opportunity for improvement in turning prospects into customers.
-
Lack of clarity in targets, planning, and reporting around the two main customer journeys: self-service vs demand to Sales. Currently, we have better sophistication around the touched-demand journey than self-serve.
Why now: market and internal constraints
The current state of GitLab's marketing performance, as evidenced by the Validation data, highlights the need for a more efficient and effective approach to growth marketing:
-
To (traffic):
- MoM: -23.41% percent change
- YoY: -30.94% percent change
- Past Q4: -0.5% YoY decline in traffic
-
Through (trial CTA click rate, all free trial CTAs):
- MoM: +10% percent change
- YoY: +5% percent change
-
In (conversion rate from Free Trial Signup page):
- MoM: -23% percent change
- YoY: -34% percent change
With the current challenges and the potential for even greater declines in performance, now is the ideal time to implement a more coordinated and efficient growth marketing initiative to drive results and reverse the negative trends.
What it unlocks: better decisions and compounding
-
Enhanced Coordination: One funnel, one scoreboard, clear DRIs. Less duplicate work and fewer handoff failures.
-
Increased Efficiency: Faster decisions because we can point at the constraint and decide what we’re not doing this quarter.
-
Improved Performance: Experiments only count as wins when they move downstream metrics, not vanity metrics at the edge of the funnel.
-
Scalability: A repeatable loop that scales as teams and surface area grow.
-
Continuous Improvement: A faster ship and review cadence, with learning that compounds.
What we asked for: org, scope, and metrics
To implement the “To, Through, In” motion, we requested support from the Chief Marketing Officer and VP of Integrated Marketing to:
-
Endorsing the proposed team structure and the shared set of principles and metrics.
-
Allocating the necessary resources (including budget, tools, and personnel) to support the initiative.
-
Championing cross-functional collaboration and communication among the Digital Strategy, Digital Experience, and Growth teams.
-
Establishing regular check-ins and progress updates to ensure alignment and visibility into the initiative's progress and results.
If we did this, we’d stop debating priorities in meetings and start debating them in a shared dashboard.
Shared metrics template (tables)
* Sales Cycle Length is specifically for Enterprise Sales Assisted
This work builds on Unified To/Through/In PLG Motion
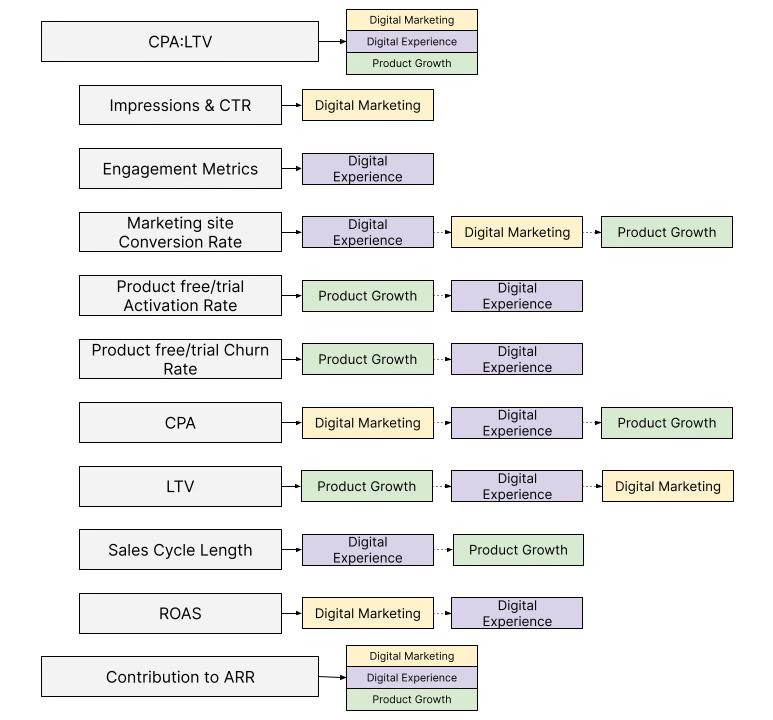
CPA:LTV Ratio
DRIs: Digital Marketing, Digital Experience, and Product Growth
This north-star performance metric represents the relationship between the cost of acquiring a customer (CPA) and the total revenue the customer generates over their lifetime (LTV). This ratio indicates the efficiency and sustainability of our customer acquisition and retention efforts. We aim to lower the CPA:LTV Ratio to ensure a more cost-effective and profitable customer acquisition strategy.
ARR Contribution
DRIs: Digital Marketing, Digital Experience, and Product Growth
Focus on driving annual Recurring Revenue (ARR) growth by working collaboratively across teams to optimize customer acquisition, retention, and upselling efforts. Continuously monitor and analyze ARR metrics to identify opportunities for improvement and prioritize initiatives accordingly.
Impressions and Clickthrough Rate (CTR) of Ads
DRI: Digital Marketing
Enhance ad visibility and engagement by refining targeting, messaging, and ad creative. Regularly analyze ad performance and iterate to increase CTR and drive higher-quality traffic.
Engagement Metrics (Site Sessions, Time on Site, Pages per Visit, Bounce Rate, etc.)
DRI: Digital Experience
Optimize the user journey from ad click to conversion by considering the user experience of the Marketing site. Monitor and analyze user behaviour to identify opportunities for improvement and drive higher engagement.
Conversion Rate (Free Trial Sign-ups, Paid Tier Selections)
DRI: Digital Experience Support: Digital Marketing, Product Growth
Improve the user journey from awareness to acquisition by focusing on the user experience of the Marketing site. Regularly test and iterate on strategies to increase conversion rates and drive customer growth.
CPA (Cost per Acquisition)
DRI: Digital Marketing Support: Digital Experience, Product Growth
Optimize ad spend, targeting, and messaging to lower CPA across customer segments. Regularly test and iterate on ad strategies to maximize efficiency and minimize acquisition costs.
Activation Rate
DRI: Product Growth Support: Digital Experience
Ensure users quickly discover value in the product, leading to higher engagement and a higher likelihood of conversion. Monitor and analyze user activation patterns to identify opportunities for improvement and prioritize product enhancements accordingly.
LTV (Lifetime Value)
DRI: Product Growth Support: Digital Experience, Digital Marketing
Improve product features, user experience, and retention to increase LTV. Continuously seek customer feedback, monitor user behaviour, and iterate on the product to maximize customer value.
Churn Rate
DRI: Product Growth Support: Digital Experience
Reduce customer churn by improving product features, customer support, and user experience. Continuously gather customer feedback and monitor churn patterns to identify and address the root causes of attrition.
Sales Cycle Length (for Sales Assisted Growth)
DRIs: Digital Experience (for marketing-related aspects), Product Growth (for product-related aspects)
Shorten the sales cycle for Enterprise opportunities by providing relevant content, engaging prospects effectively, and addressing their needs promptly. Regularly review sales processes and coordinate with the sales team to identify areas for improvement and acceleration.
ROAS (Return on Ad Spend)
DRI: Digital Marketing Support: Digital Experience
Maximize the return on advertising investments, particularly for Commercial opportunities. Continuously test, monitor, and optimize ad campaigns to drive the best return on ad spend.
Population aka Traffic (Primary: Digital Marketing, Secondary: Digital Experience) | ||||
|---|---|---|---|---|
| Metric | Current | Target | MoM Comparison | YoY Comparison |
| Total Site Sessions (simple engagement and channel table to be nested within) | ||||
| Total New Users | ||||
| Total Engaged Sessions | ||||
| Engagement Rate | ||||
LTV:CPA Ratio (for paid acq) | ||||
Platform aka Acquisition (Primary: Digital Experience, Secondary: Product Growth) | ||||
|---|---|---|---|---|
| Metric | Current | Target | MoM Comparison | YoY Comparison |
| High-value pageviews | ||||
| Trial CTA engagements | ||||
| Total inquiries | ||||
| Trial signup completion rate | ||||
| Total Free Trial Signups | ||||
| High-value Free Trial signups | ||||
Product aka Activation (Primary: Product Growth) | ||||
|---|---|---|---|---|
| All users must have started on the Marketing site first | Current | Target | MoM Comparison | YoY Comparison |
| SaaS new users | ||||
| [7 or 14 day active trials?] | ||||
| 45-day free to paid conversion rate | ||||
| Total paid conversions (non-cohorted) | ||||
| ACV at conversion | ||||
Decision support
FAQ: Fast answers, no filler
The objective, outcomes, and next best path in under a minute.
01What is Introduction of X Led Growth?
A GitLab memo that aligned Digital Strategy, Digital Experience, and Growth on a single operating loop for Commercial PLG and Enterprise sales-assisted growth.
02What problem did the memo solve?
The teams had overlapping scopes and inconsistent handoffs between demand, site experience, and in-product activation. The memo aligned them on one operating loop.
03What was built in the operating model?
Simplified segmentation to Commercial vs Enterprise, defined DRIs and handoffs, and codified shared metrics (traffic, trial conversion, and ARR contribution).
04What is the To/Through/In motion?
A simple operating model: To drives inbound demand and traffic, Through drives marketing site experience and path to action, and In drives activation and conversion inside the product.
05What results are documented?
Created a shared operating model across the teams with explicit DRIs and shared metrics. Downstream, trial conversion increased 40% and account sign-ups increased 22%.
06Who is this approach for?
Best for PLG plus sales-assisted growth where demand, site conversion, and in-product activation are owned by different teams. Less useful when the motion is single-team and single-surface.
07Where can I go deeper next?
Next, read Increase Quality Site Traffic.